Where the world is going cannot be read from GDP alone. Demography, life expectancy, trade, inflation, debt and regional relationships each describe a different part of a country's capacity to thrive. The useful question isn't who sits at the top of a single ranking — it's which conditions are improving, which are deteriorating, and which combinations make national progress more resilient than the headline number suggests.
Demography shapes the opportunity set
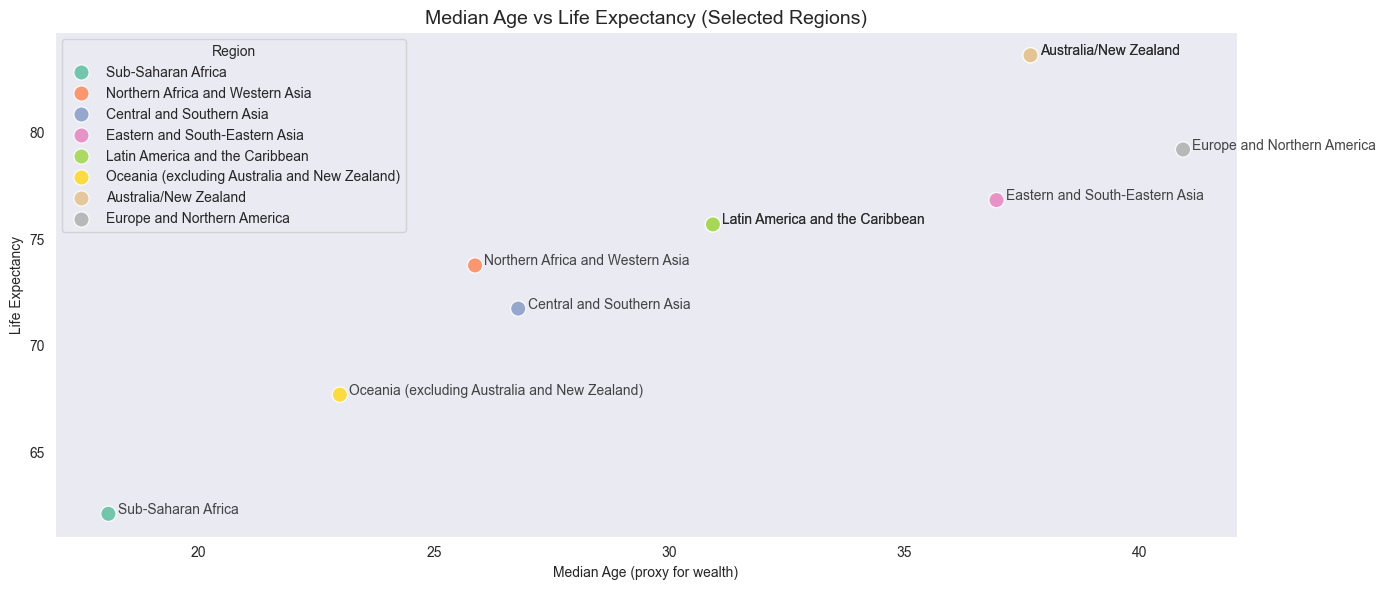
The relationship between median age and life expectancy shows how differently regions are moving through demographic transition. Some have older populations and longer lives; others have younger populations and very different development pressures. Neither position is automatically better. An ageing population can bring experience and capital but place pressure on labour supply and services. A younger population can create a demographic dividend — but only if education, jobs and institutions actually convert potential into opportunity rather than just producing more people waiting for one.
Resilience is more than growth
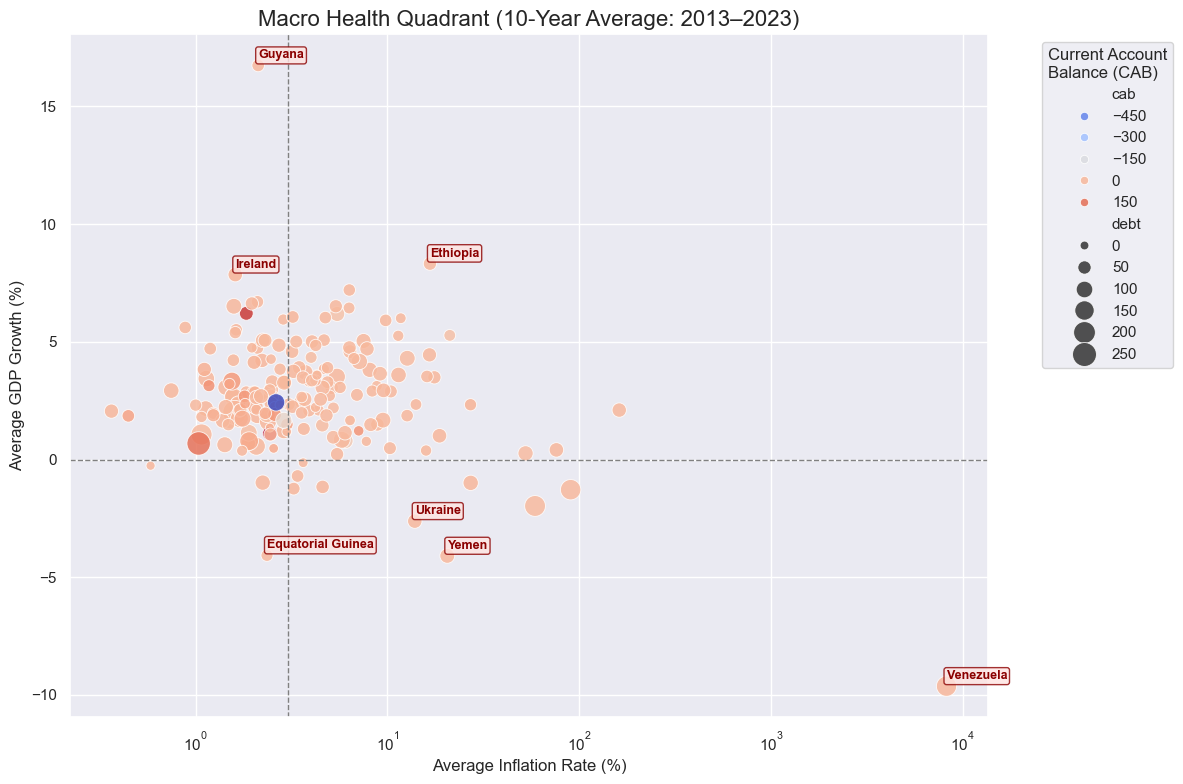
A country can post strong growth while carrying other vulnerabilities. High inflation, large debt or external imbalances can constrain future choices. Equally, a low-growth period may not tell the whole story if stability, investment and fiscal conditions are quietly improving underneath it. This is why multi-dimensional comparison matters — it makes trade-offs visible instead of treating one indicator as the whole economy.
The champions nobody puts on a poster
The trade data makes this literal. Rank countries by export growth from 2000 to 2025 and the names at the top aren't the ones you'd expect from a business-news front page. Guyana's exports grew 6,769% over that period — from $162 million to $11.1 billion — including 1,617% growth in the most recent decade alone, which is faster than even Vietnam's genuinely exceptional decade of growth to $428.9 billion. Djibouti (+3,387%) and Rwanda (+3,049%) round out a top five built almost entirely from small economies most trade coverage ignores.
Run the same "hidden champions" logic on a composite score combining GDP growth, debt, inflation and current-account balance, and it holds up again. China tops the unfiltered table — but Equatorial Guinea, Macao and Taiwan all rank immediately behind it, ahead of every G7 economy. Strip the large economies out entirely and Guyana leads the small-economy table outright, at more than double the score of the next country. These aren't rounding errors in the data. They're a genuinely different set of leaders, hiding in plain sight because nobody normally asks the question that surfaces them.
Scores are prompts, not verdicts
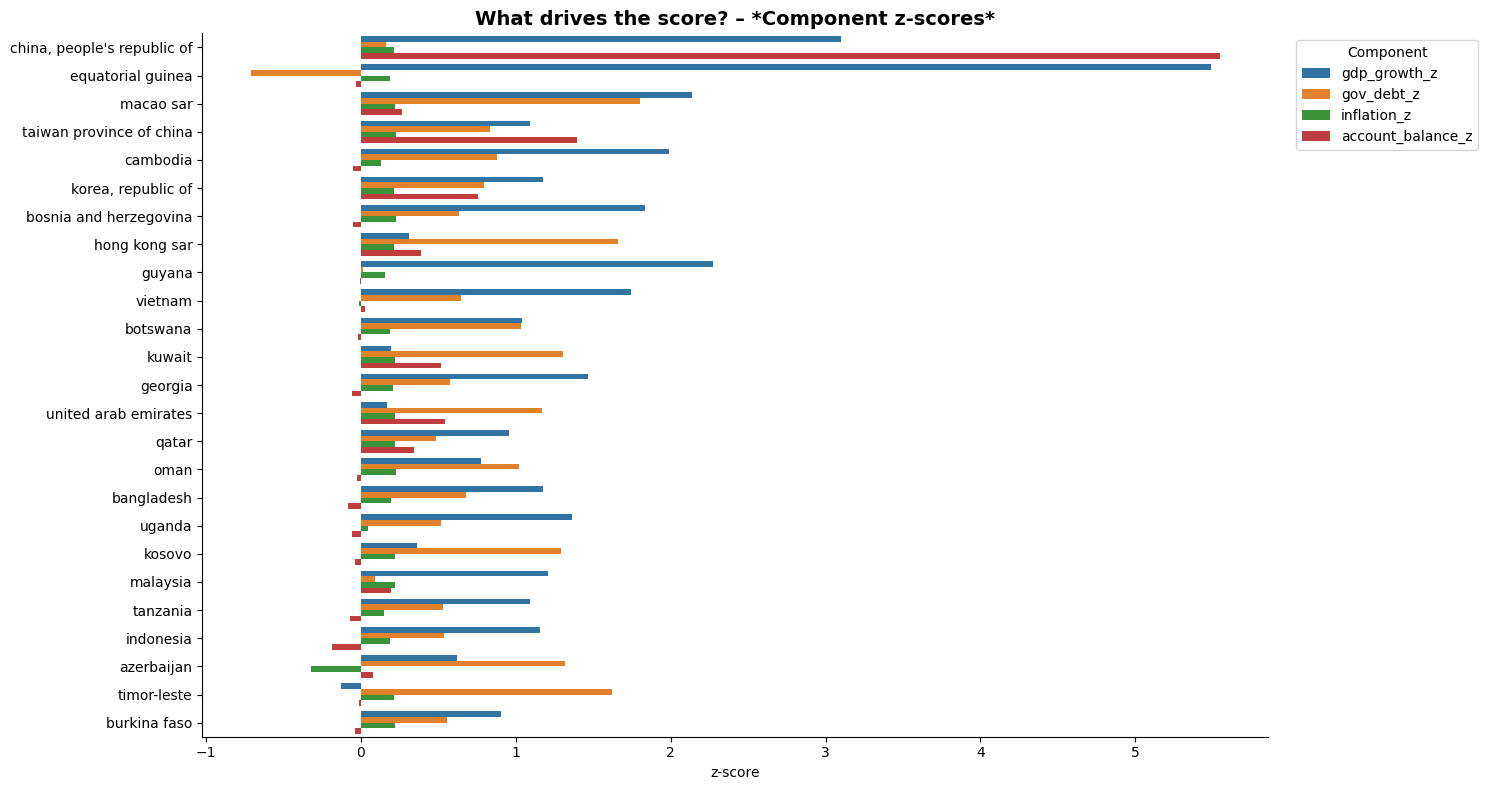
Composite scores can be useful because they bring several signals into one frame. But they should never be treated as a final verdict — their value depends on transparency: which components drive a result, where the data is thin, and how a different weighting would change the picture. Guyana's export number is largely an oil story; Equatorial Guinea's rank leans on the same commodity dynamic. Knowing that doesn't erase the finding, but it does change what you do with it.
Used carefully, a score is a prompt for better questions. Why is a country growing? Is that growth stable? Does it translate into health, opportunity and long-term resilience — or is it one commodity away from disappearing?
A more useful map of the future
The world isn't dividing neatly into winners and losers. It's producing a variety of pathways: countries with strong demographics but weak institutions, mature economies adapting to ageing, export-led growth stories running well ahead of their public profile, and composite leaders that never show up on a G7 comparison. The goal of this analysis is to make those paths easier to see — better comparison should lead to better questions, not simpler rankings.
Method
Combines several exploratory global datasets covering population, longevity, trade, growth, inflation, debt and current-account measures. Coverage and time periods vary across sources; composite indicators are descriptive constructions, not official rankings or forecasts.