Fifteen years of Premier League data can tell a story about more than champions. It can show how dominance accumulates, which teams combine attack and defence efficiently, and why fair comparison matters when clubs have played different numbers of matches or seasons. The first lesson, though, isn't glamorous: reliable history has to come before clever modelling — and this dataset proves it the hard way.
The season the data got the title wrong
Compute the champions directly from raw match results, season by season, and the output looks plausible right up until it isn't. It credits Arsenal with the 2008-09 title. It credits Arsenal again in 2015-16. Neither is true. Manchester United won in 2008-09; Leicester City won in 2015-16, at 5000-1 odds, in what's still one of the greatest upsets in the sport's history. The naive computation doesn't just get two seasons wrong — tallied up, it hands Arsenal seven "titles" that were never won.
That's not a footnote. It's the whole argument for data hygiene in one concrete failure: a table that looks complete, reads plausibly, and is simply incorrect, caught only because someone checked it against what actually happened. Every number in the rest of this article assumes that check was done properly.
Sustained success leaves a long trace
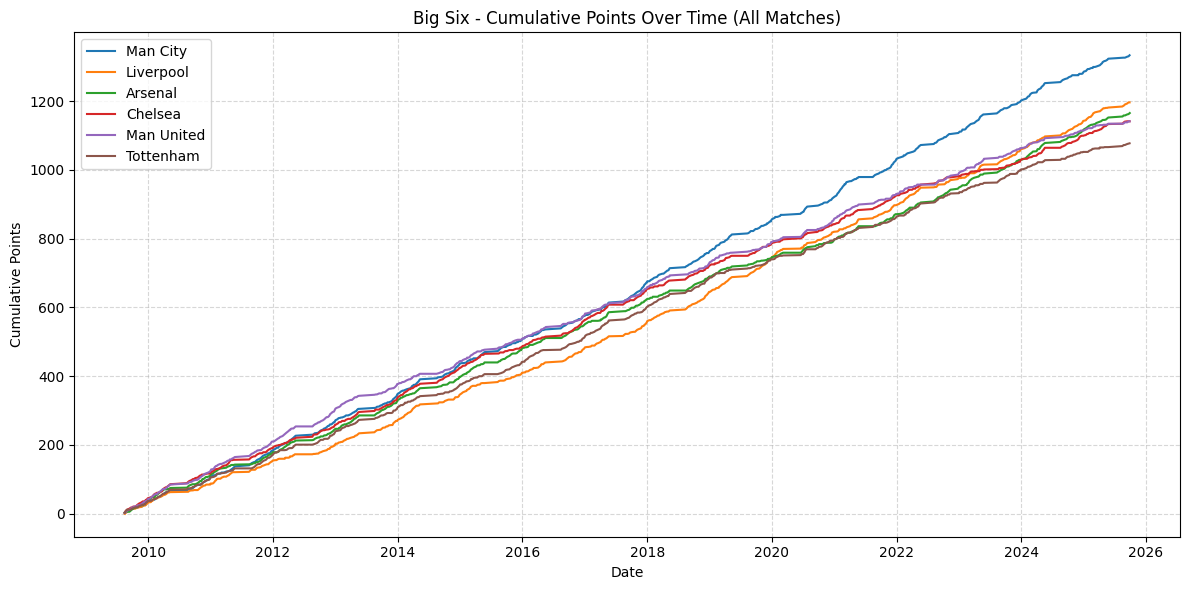
Cumulative points make the broad hierarchy visible once the season assignment is fixed. Over a long period, the leading clubs separate because they sustain performance through multiple managers, squads and competitive cycles. But raw totals also reward longevity — which is why the analysis moves beyond the historical line to per-game and efficiency measures. The question isn't only who's collected the most points. It's how those points were earned.
The best teams balance attack and defence
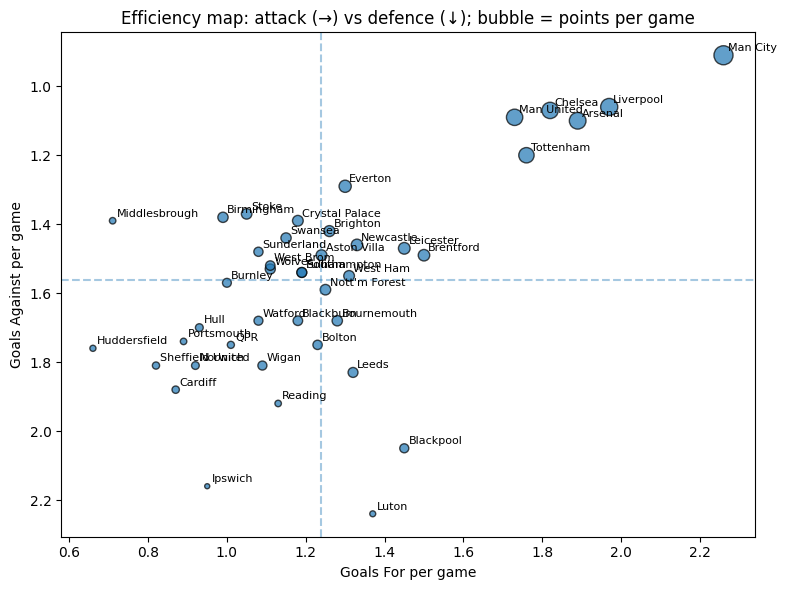
The strongest teams tend to occupy the upper-right part of this map: they score more, concede less, and convert that balance into points. No single metric is enough, but the combination explains more than a league table alone — and it creates fairer comparisons between clubs that haven't spent the same amount of time in the league.
The discipline model that talked itself out of its own conclusion
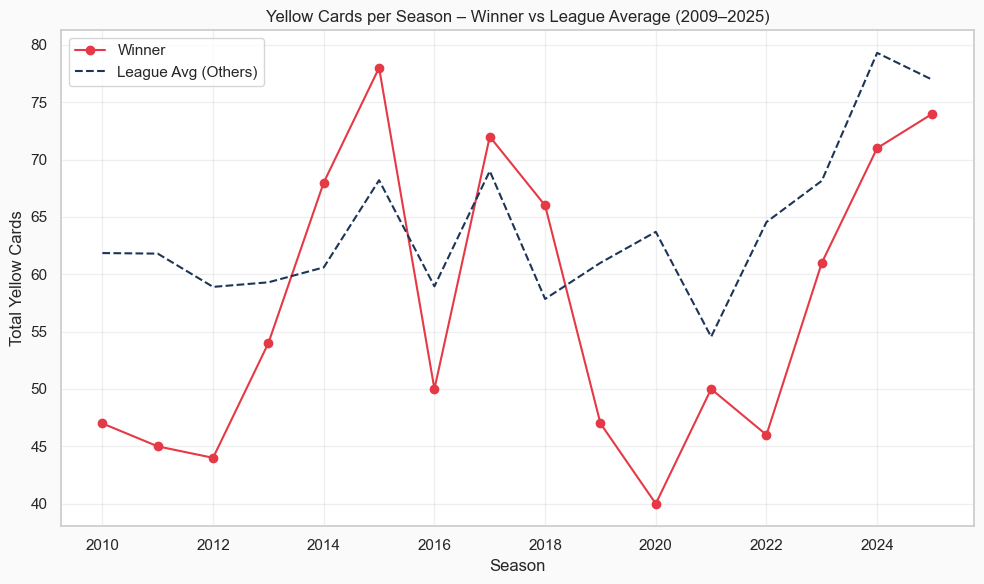
The card analysis set out to test a common intuition: that champions win partly through controlled aggression, some disciplined middle ground between recklessness and passivity. So the notebook builds a logistic regression predicting a top-3 finish from average yellow cards against top-6 opponents. The result doesn't support the story it was meant to tell. The coefficient comes back negative — more cards against elite opponents associates with a lower chance of finishing top-3, not a "sweet spot" — and the classifier scores zero precision and zero recall on the top-3 class. It never once correctly predicts a top finisher.
That's worth stating plainly rather than smoothing over: the model found no real signal here. Champions aren't consistently the least-carded teams, and this particular attempt to formalise "controlled aggression" into a predictive rule doesn't hold up against its own test. The honest conclusion isn't a refined discipline formula — it's that elite teams manage risk, style and performance in ways this model wasn't able to capture, and that's a more useful finding than a false positive would have been.
What sustained success looks like
Sustained success is a profile, not a single statistic: strong points accumulation, efficient attack, resilient defence, and enough adaptability to stay competitive as the league changes. It does not, on this evidence, include a tidy discipline formula. The value of the analysis is in making that profile inspectable — including the parts of it that don't resolve neatly.
Method
Combines seven exploratory notebooks using historical Premier League match and team-performance data: data-cleaning (including a manual champions cross-check), cumulative and per-game comparisons, performance profiling, and statistical modelling. Results are descriptive rather than causal — tactics, spending, player availability and fixture difficulty aren't controlled for.