Global renewable rankings are useful — and incomplete. Large economies lead in absolute output because they have large populations, large power systems and growing demand. Smaller countries can lead by renewable share. Neither measure alone tells you whether a transition is durable, and both hide a question that turns out to matter more: who's actually on a repeatable trajectory, rather than just sitting at the top of this year's table.
Scale matters, but it is not the whole story
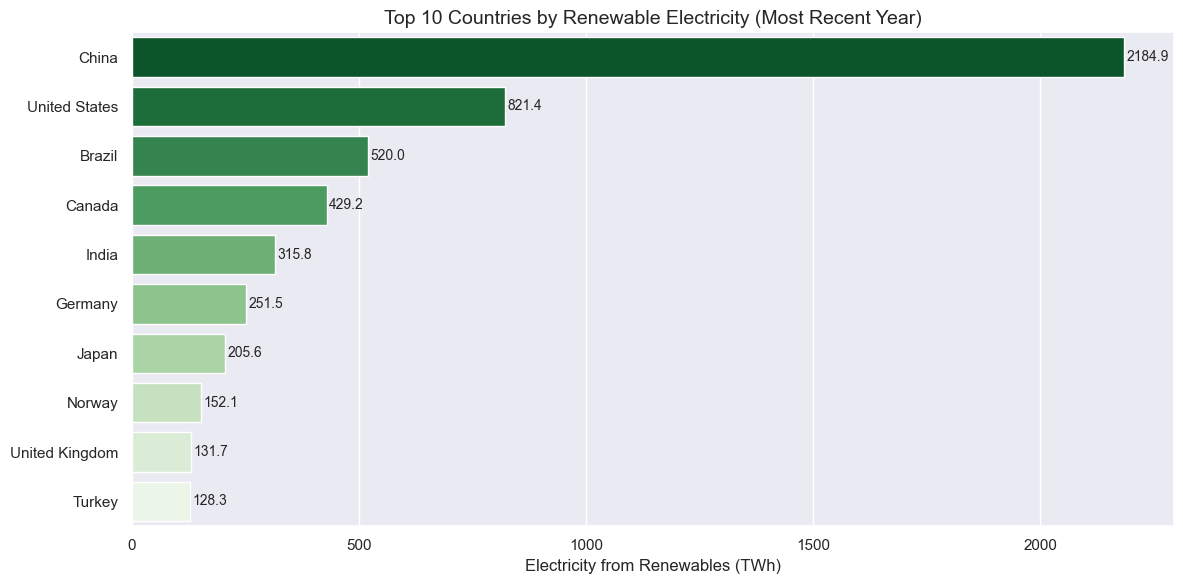
The most recent-year ranking makes the scale of renewable electricity unmistakable. China sits in a category of its own, followed by the United States, Brazil, Canada, India and major European economies. That scale matters for global emissions, manufacturing capacity and how fast clean technologies get cheaper for everyone else.
But a ranking is a snapshot, and snapshots flatter whoever happens to be largest. Normalise by population instead of looking at absolute terawatt-hours, and the leaderboard doesn't just shuffle — it flips. India's population is more than ten times Germany's, which alone explains a huge share of the gap between them in absolute terms. Run the same countries per capita and Norway, nowhere near the top of the raw ranking, becomes a serious contender for the actual lead. The "who's winning" question turns out to depend entirely on which denominator you choose.
Look for trajectories, not podiums
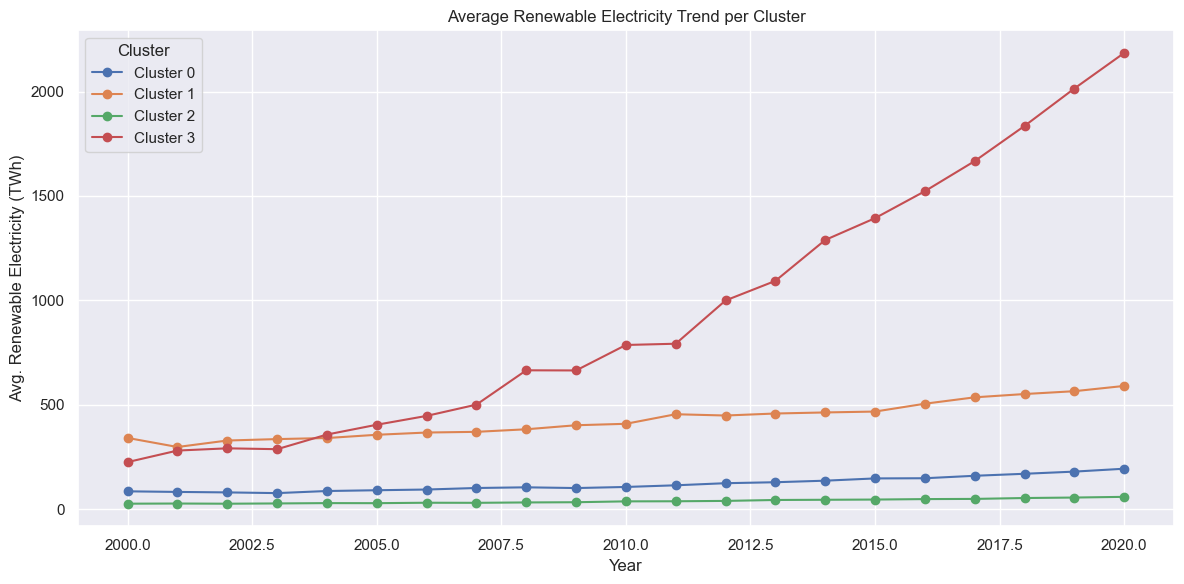
The country trend map makes the shape of growth clearer than any single-year rank could. China's climb isn't a long, steady one — it has a visible inflection point around 2010, after which growth turns exponential. The United States, over the same period, follows something closer to a gradual line. Both countries end up near the top. They got there on completely different curves, built on different policy, financing and industrial conditions — which means "China leads" and "the US is progressing steadily" are both true and describe two different kinds of transition, not degrees of the same one.
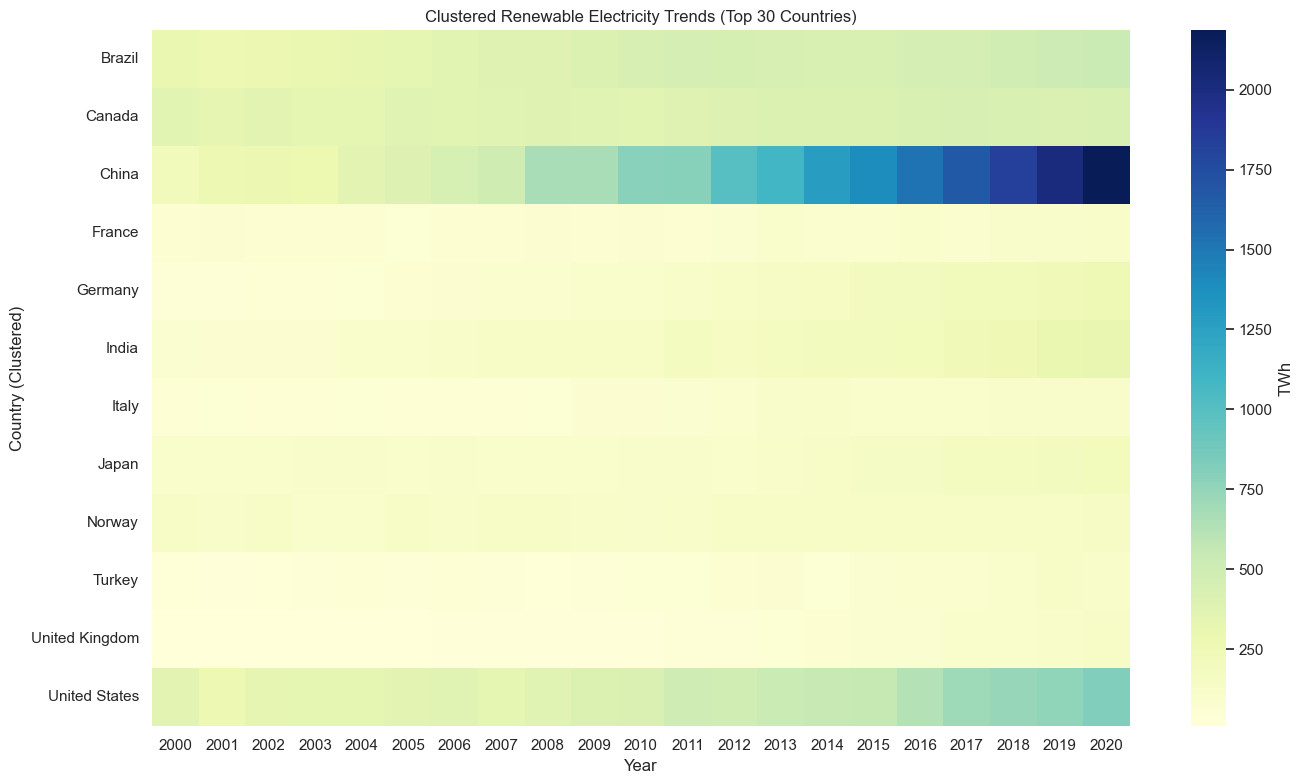
Clusters reveal different transition stories
The cluster view turns a league table into a set of questions. Which countries are scaling from an already-high base? Which are growing rapidly from a lower one? Which look stalled? And what combination of resource quality, grid investment, industrial policy and market design sits behind each path? Data can't answer those questions by itself, but it gives decision-makers a sharper starting point than a top-ten chart ever could.
What leadership should mean
A credible green-energy leader isn't simply the country with the largest renewable total — that's just population and time. Leadership can mean scale, speed, consistency, system integration, or the ability to build a model other countries can actually copy. Norway's per-capita position and China's post-2010 inflection are both "leadership," just not the same kind, and the best comparison depends entirely on the decision being made.
That's the real point of looking at trajectories instead of trophies: it moves the conversation from who's first today to who's actually building something that lasts.
Method
Compares renewable electricity generation in absolute terawatt-hours across countries, checks the picture against a per-capita view, and groups leading countries by time-series pattern. Absolute output favours large economies by construction; it doesn't measure share, emissions intensity or policy quality.