Climate risk becomes real when it's visible. Sea-level records make one consequence of warming tangible; emissions data points to the systems where action has leverage. Put together, they turn a broad climate problem into a practical transition question — and the key is resisting the urge to treat every country and every sector as though it faces the same one.
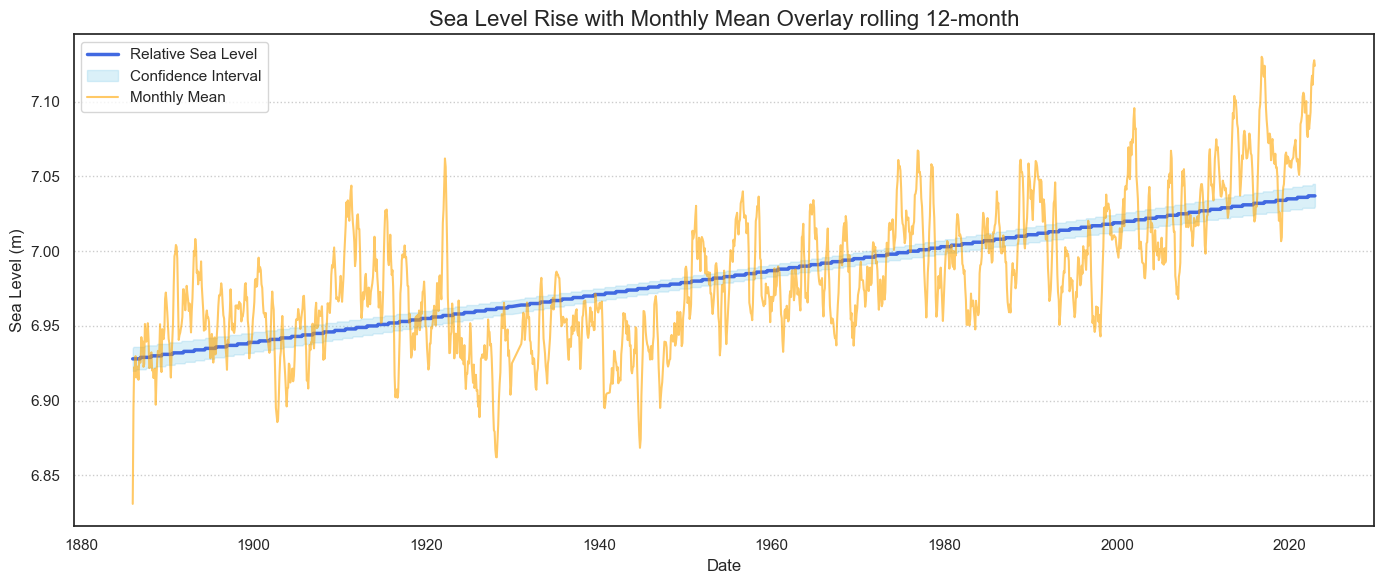
Risk has a measurable trend
The sea-level record doesn't move in a straight line month to month. Weather, seasons and measurement noise all matter. But the long-run trajectory rises through the record, making the underlying risk visible even as short-term variation continues. That's a useful starting point for policy: consequences here aren't abstract, and they accumulate over time whether or not anyone's watching closely.
Emissions reduction has clear leverage points
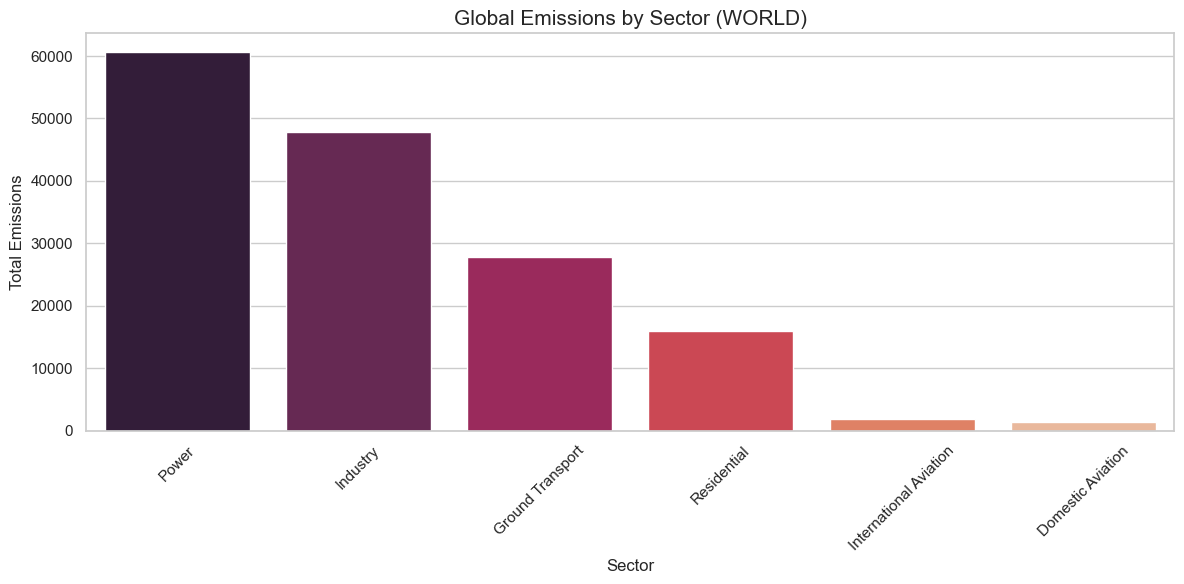
The sector breakdown isn't a complete policy prescription, but it's a useful map. Clean power supports electrification. Industrial transformation needs new processes and fuels. Transport requires a mix of vehicle technology, networks and better choices about how people and goods move. There's no single intervention — but there are clearly different, specific levers, and confusing them wastes effort.
Two countries carry most of the story
The country-level emissions data adds a sharper edge to this than a sector chart alone can. China and the United States were roughly at parity in the early 2000s. They aren't anymore — China's emissions are now more than double the US total, a gap that opened up inside two decades, not a slow historical drift. And the US comparison doesn't stop there: on its own, the United States has historically emitted roughly as much as every other OECD member combined. Not the largest OECD contributor — comparable to the entire rest of the bloc, added together.
Those two facts change what "shared responsibility" actually looks like in practice. A sectoral emissions map says where the levers are. These numbers say which countries are holding most of them.
National pathways are different by design
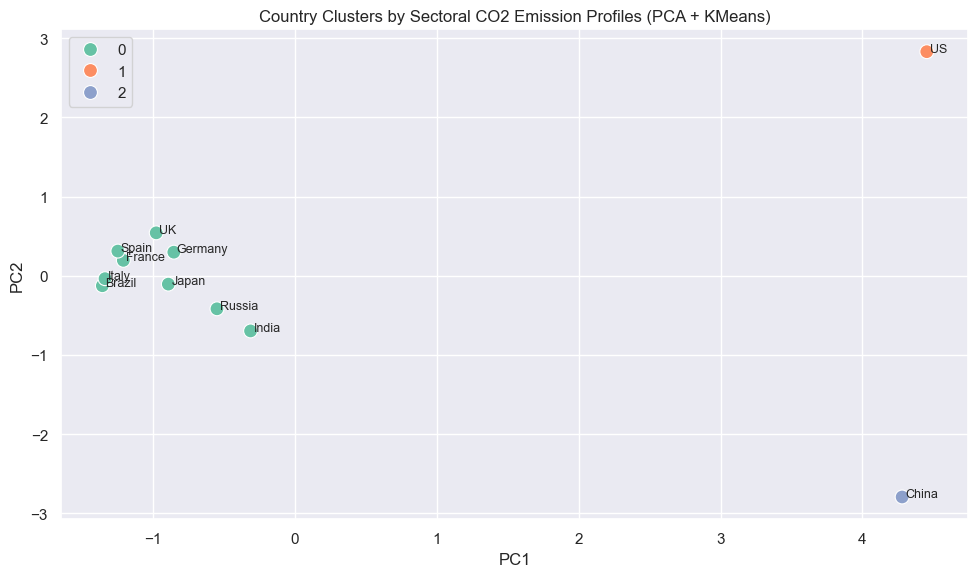
Country clusters make this point visually. Large power-sector emitters don't face the same transition as transport-heavy or industry-heavy economies. Countries with similar sectoral profiles may have more to learn from each other than countries that merely have similar headline emissions totals — that's a more constructive basis for cooperation: shared technology needs, financing constraints and sector-specific policy lessons, rather than a shared spot on a league table.
From evidence to policy
The central question isn't who's to blame. It's where action has the greatest leverage — and the country-level concentration in China and the US means leverage isn't spread evenly either. Clean electricity, electrification, industrial change and targeted support each matter, but in very different combinations depending on which system, and which country, is actually being discussed.
Good climate policy starts with that specificity. It turns risk into a mandate for action, and emissions data into a guide for where — and with whom — to begin.
Method
Combines exploratory analyses of country emissions pathways, global sea-level measurements and sectoral emissions profiles. Useful for broad patterns, not a causal attribution study or a complete greenhouse-gas inventory; country clusters are descriptive, not a ranking of responsibility.