Climate evidence is most persuasive when independent records point in the same direction. Surface temperature, satellite observations and atmospheric carbon-dioxide measurements don't measure the same thing, aren't collected the same way, and don't even share the same starting decade. Their agreement is therefore more meaningful, not less. Together they describe a clear chain: greenhouse gases accumulate in the atmosphere, global temperatures rise, and the energy systems producing those emissions become a practical place to act.
The long-run warming signal is unmistakable — and it's speeding up
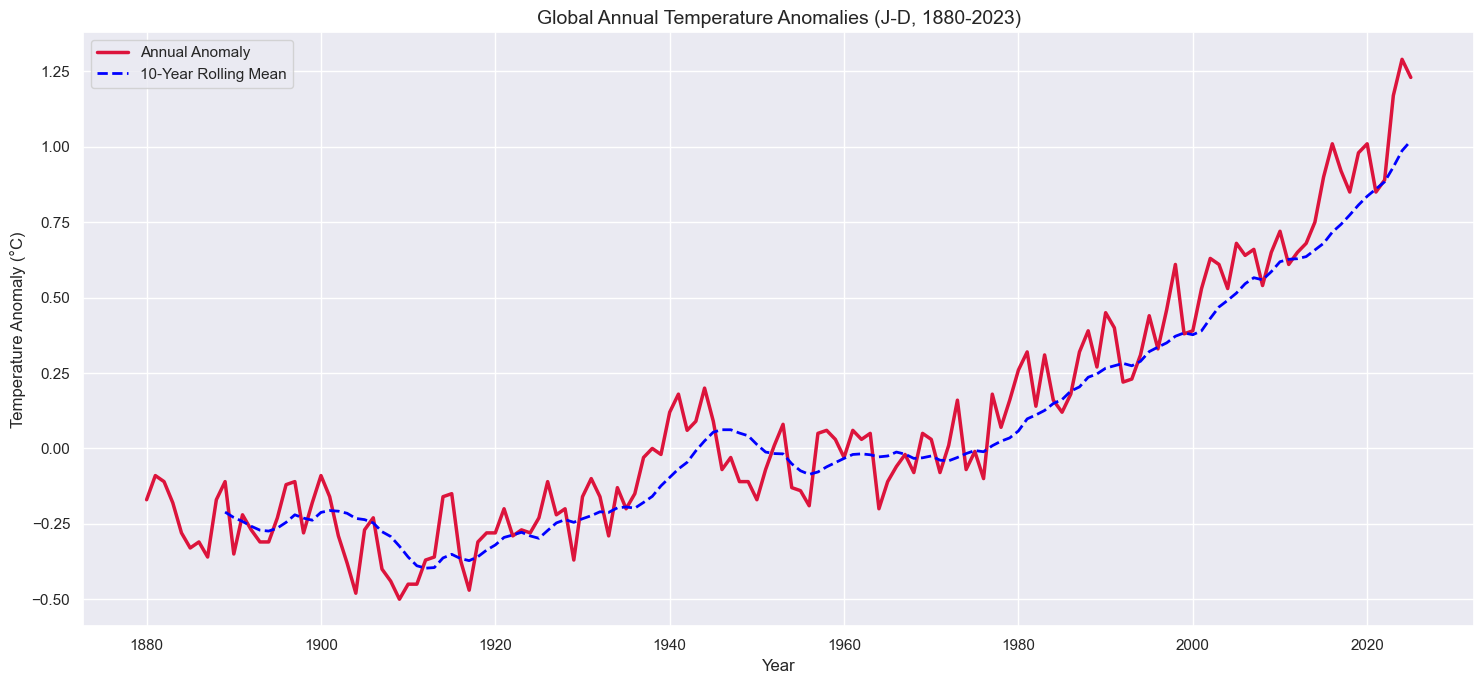
The global surface-temperature record turns year-to-year noise into a longer story. Individual years jump around the trend, but the direction of the rolling average is clear: recent decades sit well above the earlier baseline. Put a number on it and the shift is stark — roughly 1.1°C of warming since 1880, with about 70% of that increase landing after 1980. That's not a straight line stretched over 145 years; it's most of a century's worth of change compressed into the last forty. A quadratic fit to the record shows the curve bending upward, not flattening, which is the signature of acceleration rather than steady drift.
This isn't a claim built on one exceptional year. It's a shift in the distribution of temperatures across more than a century of observation, and the shape of that shift — late, fast, still rising — is arguably more informative than the headline number itself.
The atmospheric forcing is visible too
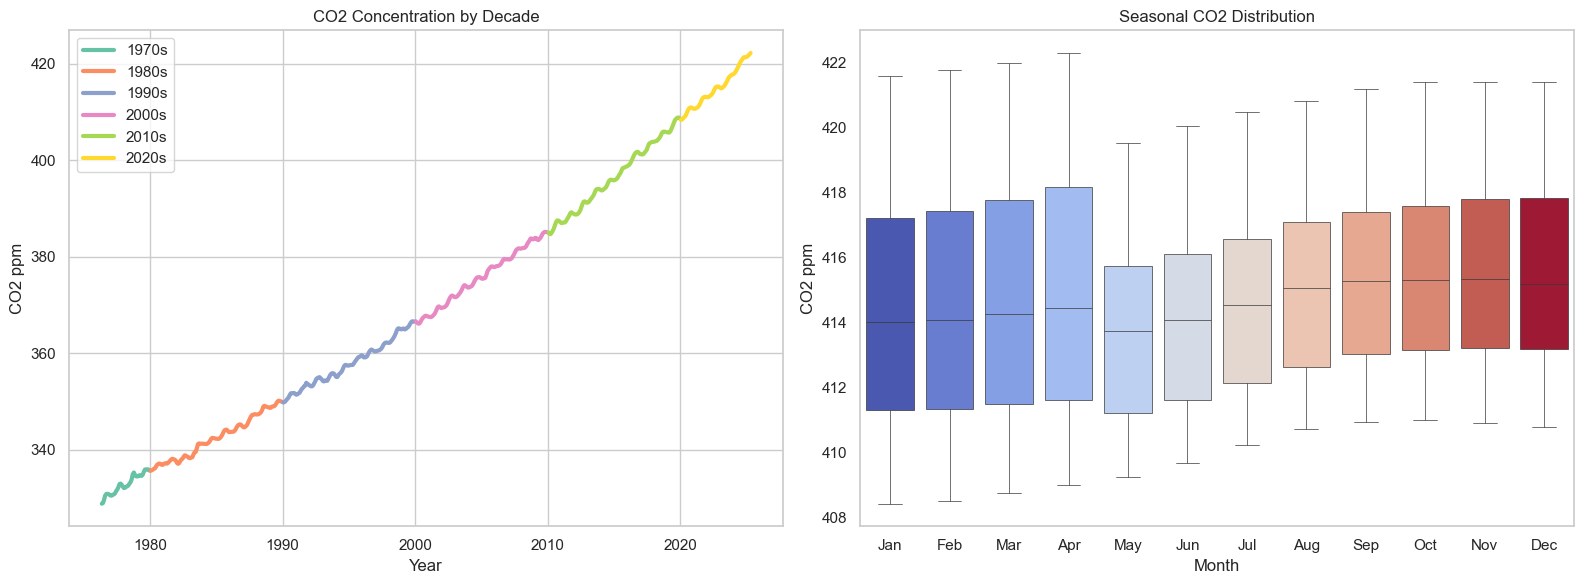
Atmospheric CO₂ is a different measurement system from surface temperature, yet it tells a compatible story. The concentration record rises through successive decades while retaining its annual seasonal rhythm — the seasonal wobble is normal variation, the climbing baseline underneath it is the actual signal.
Satellite observations add a third, more recent lens, and a genuinely independent one: different instrument, different physical principle, different institution running the numbers. Fit a straight line to the AIRS satellite anomaly record from 2002 to 2025 and it produces its own statistically significant warming slope — a separate confirmation, arrived at a completely different way, of what the ground stations already show. That's the strongest form of evidence going: not one long record, but several short, independent ones all leaning the same direction.
Energy is the response lever
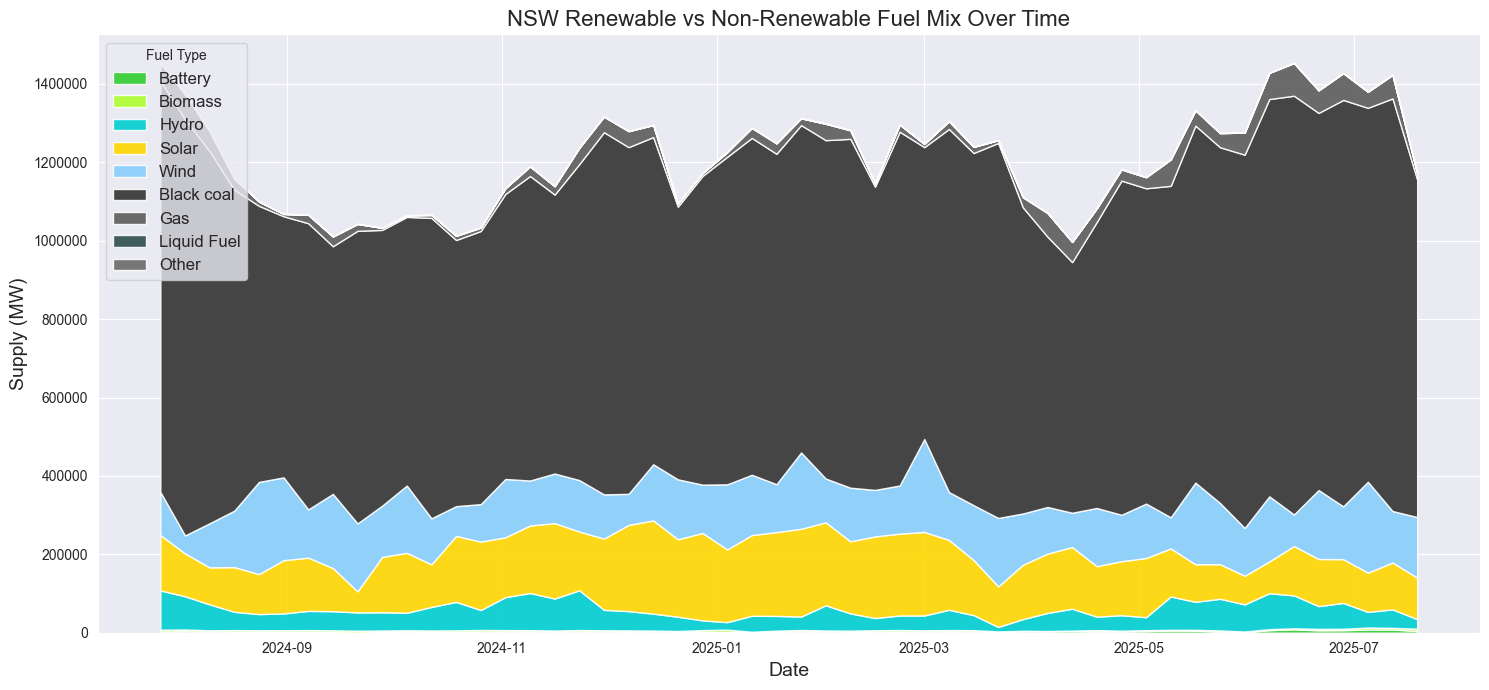
The evidence isn't an abstract argument about charts. Electricity generation is one of the systems that can actually change the trajectory. The task is disciplined system change: cleaner generation, transmission, storage, efficient demand and transparent measurement of progress. The power-system chart doesn't claim that one region solves a global problem — it shows why the grid is such an important response lever. Decarbonisation has to make cleaner supply reliable, affordable and available when people actually need it, not just cleaner on paper.
Evidence should lead to better decisions
The value of this evidence chain isn't panic. It's clarity — an accelerating, multiply-confirmed signal, paired with a concrete lever that's already moving. That combination gives policy-makers, investors and citizens a common factual basis for choosing where to act, and it's what makes the energy transition more than an abstract commitment: it links a measurable, accelerating problem to infrastructure decisions that can actually reduce emissions at scale.
Method
Combines exploratory analyses of Australian electricity supply, global surface temperature, AIRS satellite anomalies and Cape Grim atmospheric CO₂. Different periods and geographies mean this isn't a formal attribution study — its role is showing converging evidence across independent measurement systems.