National inequality figures are useful, but they can obscure the cities where economic difference is actually lived. Housing, transport, employment, public space and access to services all land in particular metropolitan areas — not in a national average. City-level evidence can bring that local reality into view. It can also reveal a less comfortable fact: the places best measured are not necessarily the places where inequality matters most.
Coverage is part of the evidence
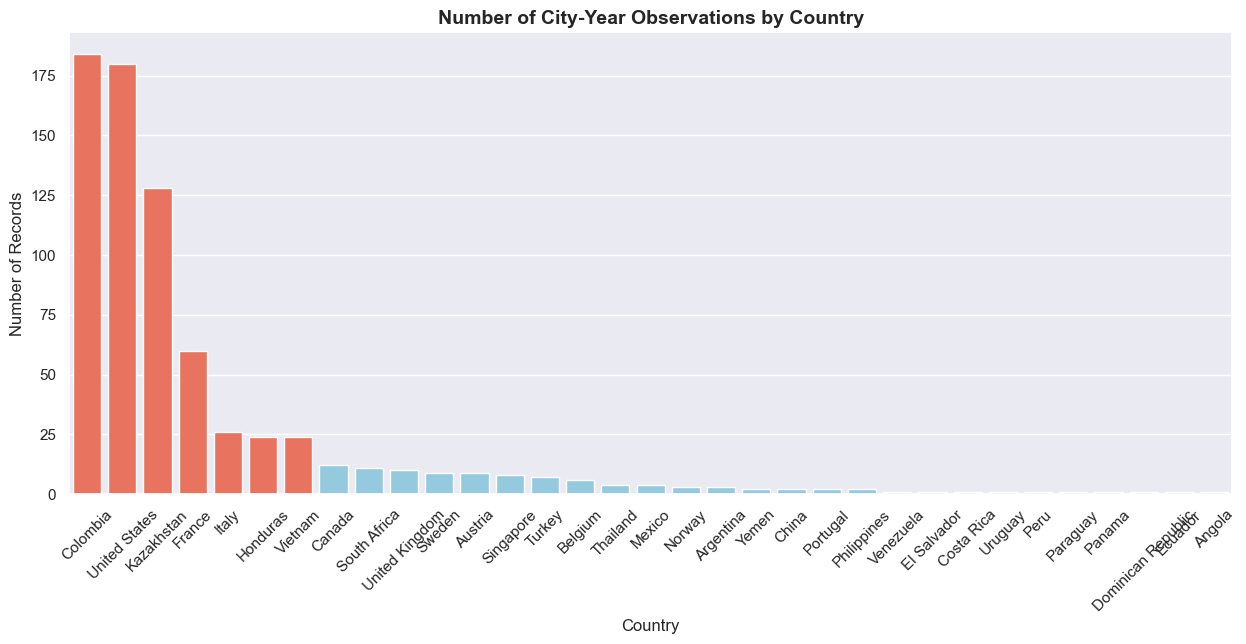
The first chart isn't about inequality itself. It's about the data available to study it. Some countries have many city-year observations; others have very few. That shapes what researchers, policy-makers and citizens can actually see — a data gap isn't merely a technical inconvenience, it can become a policy gap when urban change isn't measured consistently enough to be recognised.
Cities need their own evidence base
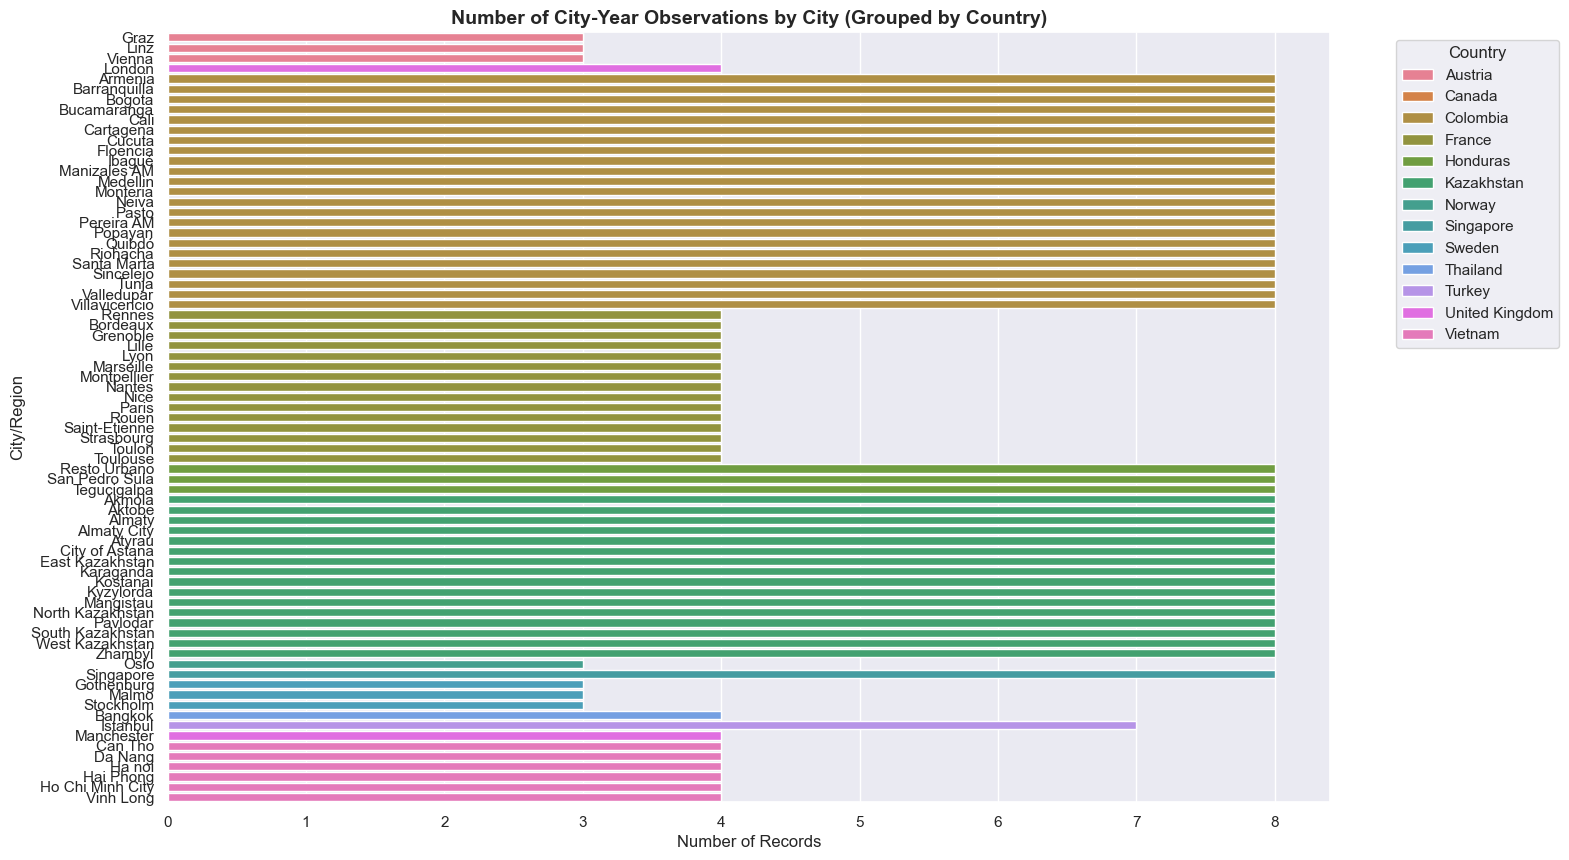
The monitoring pattern tells us where comparison is strongest, and it turns out to be a very narrow place. Of every country in the dataset, only four have even one city with complete eight-year Gini coverage: Colombia, with 23 such cities, Kazakhstan with 16, Honduras with 3, and Singapore with 1. Between them, Colombia and Kazakhstan account for 39 of the 43 cities worldwide with genuinely full temporal depth — 91% of the entire "gold standard" sample concentrated in two countries. Robust trend analysis, in practice, is only possible for a narrow and distinctly non-representative slice of the planet.
This matters for the policies that shape city life. Housing affordability, public transport, labour markets and access to green space all interact with inequality at metropolitan scale — but only in the handful of places where anyone is actually tracking it consistently enough to notice.
What counts as a "city" is doing a lot of quiet work
The coverage problem isn't just about how often a place is measured — it's also about what's being measured under the same label. Look closely at the underlying entries and "city" turns out to be a loose category: West Kazakhstan and East Kazakhstan, both oblasts rather than cities, sit in the dataset alongside genuine metropolitan areas like Luanda and Sincelejo. Guilford — a county in North Carolina, not a city at all — appears with its own Gini value. That's not a minor labelling quirk. It means any claim to strict city-to-city comparability needs a caveat this dataset doesn't supply on its own.
National stability can hide local difference
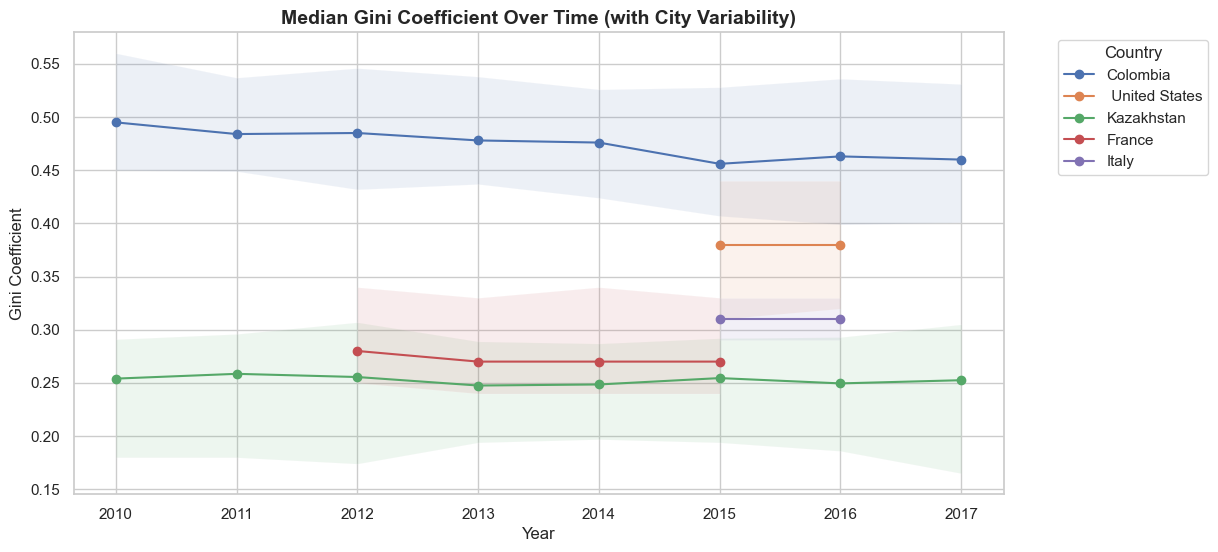
The trend view is deliberately cautious. It doesn't claim a handful of cities represent an entire country. Instead it shows why national figures should be read alongside metropolitan evidence: cities within the same country can experience very different levels and trajectories of inequality — and, per the coverage numbers above, most countries currently offer no way to check.
That's the city inequality question, sharpened: where is prosperity shared, where is it concentrated, and how much of the answer are we actually able to see?
Better city data makes better policy possible
Urban inequality isn't an abstract social indicator. It affects whether people can reach jobs, heat and cool their homes, participate in public life and benefit from economic growth. Better, more consistent metropolitan data won't solve those problems by itself — with 91% of full-depth coverage sitting in two countries, and "city" itself an inconsistently applied label, it does make the problems harder to ignore and easier to target where the data actually allows it.
Method
Uses the urban Gini data available in the source analysis to compare coverage, monitoring intensity, geographic labelling consistency and median inequality patterns over time. City samples are uneven across countries and years and shouldn't be treated as a complete national inequality measure.