Twenty-five years of National Electricity Market data tell a story that a single number can't. "Renewable share" is the headline everyone reaches for, but sit with the full dataset for a while and a different picture forms — one where generation, emissions, price and season are all pulling on each other at once, and the interesting part is how they move together.
Coal built the system it's now leaving
The NEM wasn't designed around renewables — it was designed around coal. From the 1990s market restructuring onward, a handful of large, predictable, always-on generators set the terms for everything downstream: where transmission lines ran, how the market cleared price, how whole regional towns built their economies around a single plant's payroll. That's not ancient history. Coal still supplied the majority of generation for most of the period this dataset covers, and the physical grid — the wires, the substations, the dispatch logic — was built to serve it. Understanding where the system is going starts with being honest about what it was built for.
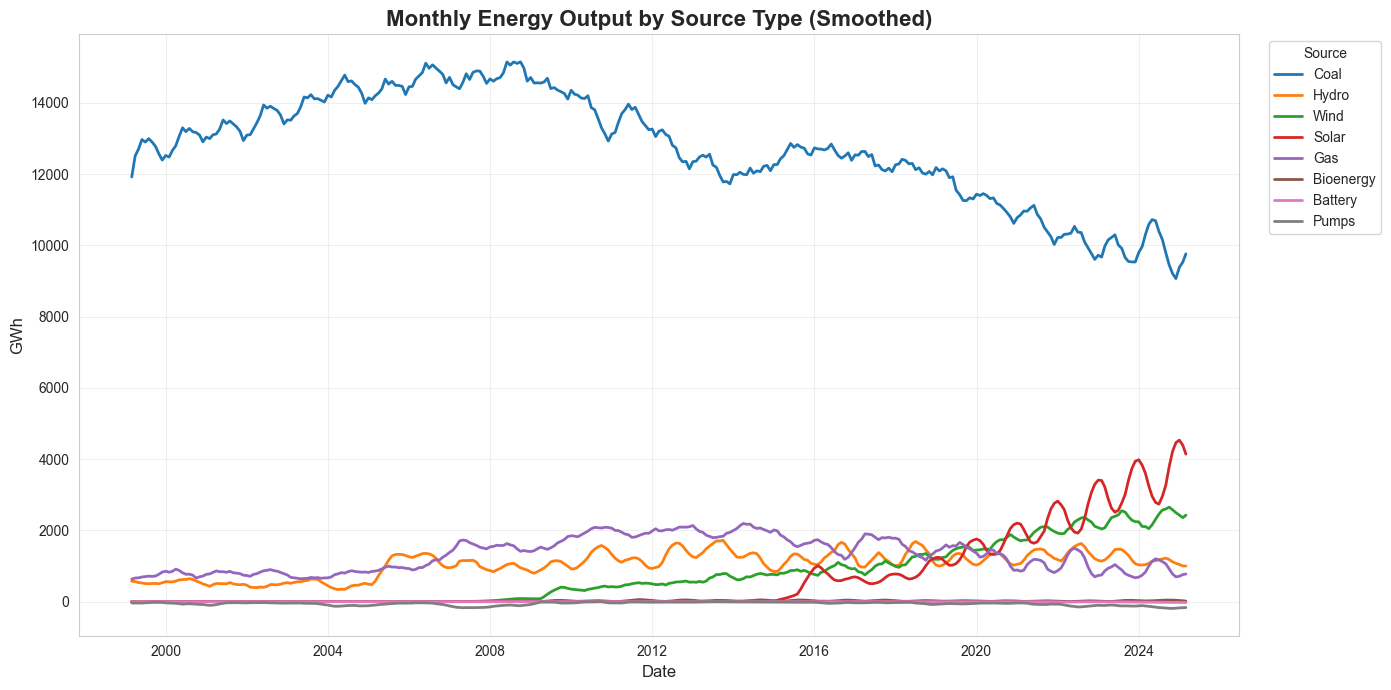
That legacy doesn't disappear because a chart shows renewables climbing. But the numbers on growth rate are where the story turns sharp. Track it month by month over the full 25 years and black coal's growth rate sits at just 0.3% — essentially flat, a fuel source coasting on inertia. Wind, over the same window, is growing at more than 6% a month on average. That's not a gentle transition. That's one technology standing still while another compounds at roughly twenty times the rate, quietly, in the background of every "renewables are rising" headline.
The grid runs on a rhythm, not a switch
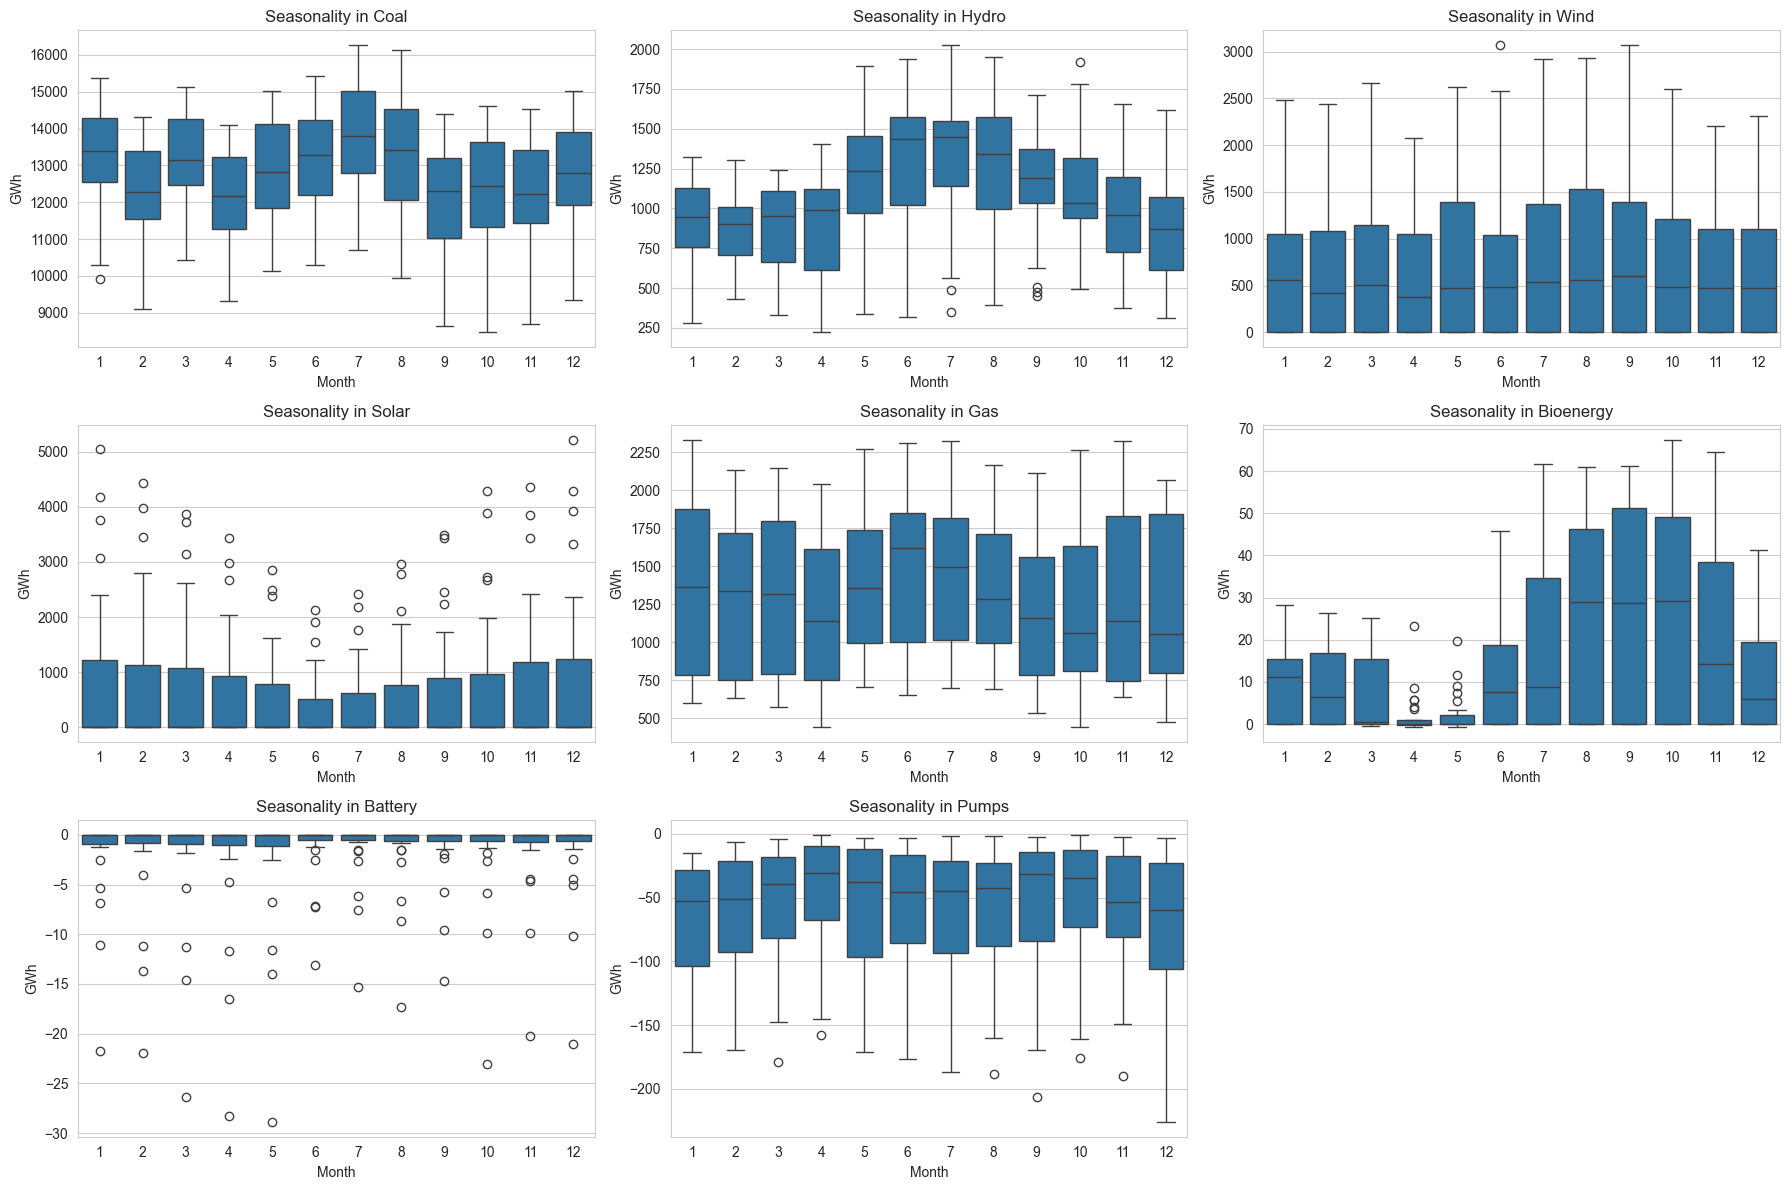
Annual totals flatten time into a single number, and that's exactly what makes them misleading. Solar peaks with daylight and the brighter months. Wind has its own separate seasonal signature. Hydro rises and falls with water availability, not policy. None of this is a flaw to be engineered away — it's the actual shape of the next grid, and pretending otherwise just delays the harder conversation.
A system built on variable generation only works if three things exist alongside it: transmission to move power across regions, storage to move it across time, and demand flexible enough to use abundant cheap electricity when it's actually available rather than when habit says it should be used.
Price is starting to tell its own story
Here's the part that doesn't get talked about enough: emissions intensity used to be a decent proxy for price pressure, and it's stopped being one. Plot average price against emissions across the full dataset and some of the highest price spikes in recent years land nowhere near the highest emissions points. The two lines are coming apart.
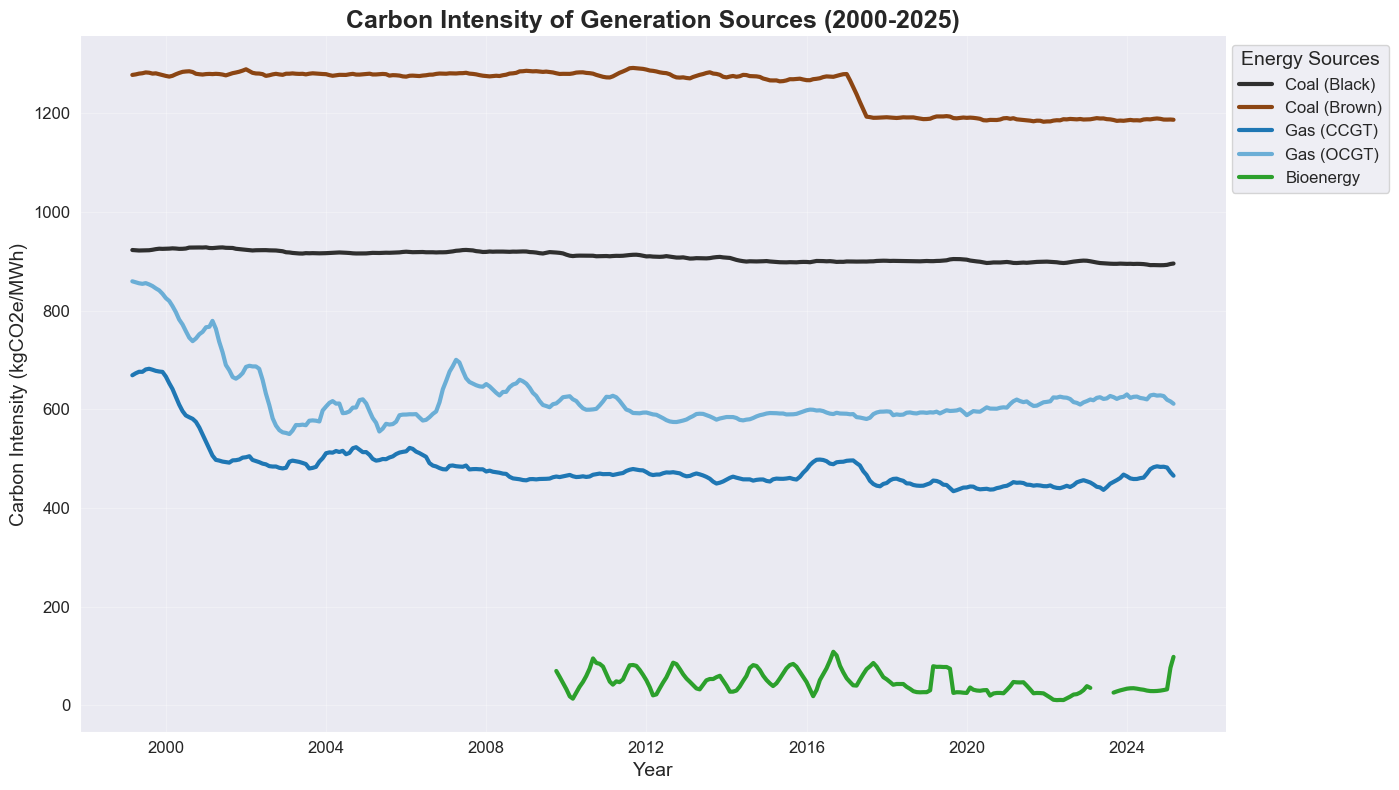
Figure 2. Carbon intensity differs sharply by technology, making the generation mix a central transition question — but price is increasingly answering to something else.
That decoupling matters because it changes what "success" looks like. A cleaner grid doesn't automatically mean a cheaper or more stable one — increasingly, price looks driven by scarcity, market structure and the mechanics of the transition itself, not simply by how much carbon is being burned that day.
What the data suggests next
Three questions fall out of this, and none of them are rhetorical. Can transmission connect renewable-resource regions to demand fast enough to keep pace with wind's compounding growth? Can storage and flexible demand absorb a generation profile that now swings by season and by hour, not just by year? And if price has genuinely decoupled from emissions, what is setting it — and can that be steered on purpose rather than watched from the sidelines?
Australia has already answered the question of whether renewable generation can grow — at 6%+ a month, compounding, it plainly can. The harder, more interesting question is whether the rest of the system — wires, storage, markets — can keep up with it.
Method
Combines two NEM analyses — a rolling growth-rate comparison by fuel type and a price-versus-emissions scatter — using historical, aggregate market data. Aggregate data shows long-run patterns well; it doesn't capture every regional constraint, dispatch event or transmission bottleneck.